- CellxGene
- Find Published Data
- Contribute and Publish Data
- Download Published Data
- Analyze Public Data
- Get Started
- Hosted Tutorials
- Gene Expression Documentation
- Annotate and Analyze Your Data
- Join the CellxGene User Community
- Cite cellxgene in your publications
- Frequently Asked Questions
- Learn About Single Cell Data Analysis
Gene Expression Data Processing
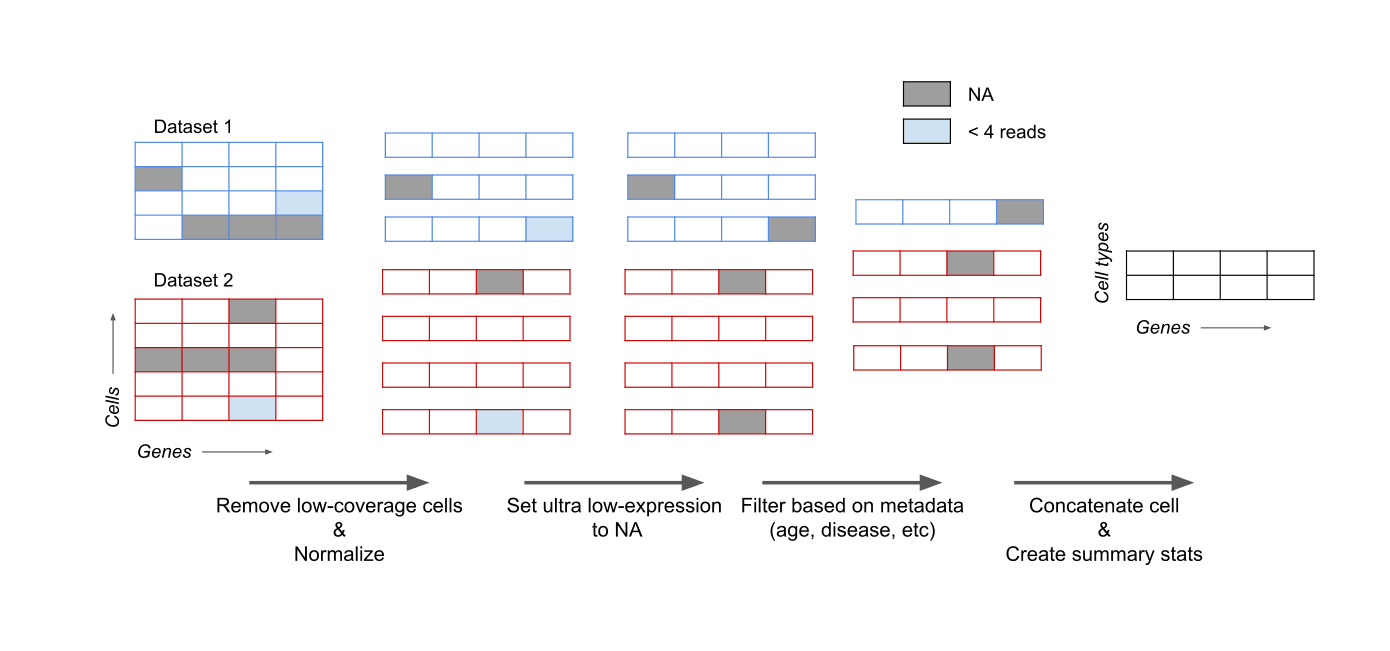
Figure 5. Overview of processing steps from raw read counts to gene expression averages per cell type.
Removal of Duplicate Cells
Some data on CELLxGENE Discover is duplicated due to independent submissions, for example meta-analysis vs original data. All data submitted on Discover is curated to indicate whether any cell is the primary data. Only cells demarcated as primary data are included in the processing steps below.
Removal of Low Coverage Cells
Any cell that has less than 500 genes expressed is excluded, this filters out about 8% of all data and does not eliminate any cell type in its entirety. This filter enables more consistent quantile vectors used for the normalization step.
Removal of Cells Based on Sequencing Assay
Only cells from sequencing assays that measure gene expression and don't require gene-length normalization are included.
Cells from the following assays are included:
| Assay | EFO ontology term ID |
|---|---|
| sci-RNA-seq | EFO:0010550 |
| 10x 3' v1 | EFO:0009901 |
| 10x 5' v1 | EFO:0011025 |
| 10x 3' v2 | EFO:0009899 |
| 10x 5' v2 | EFO:0009900 |
| 10x 3' v3 | EFO:0009922 |
| 10x 3' transcription profiling | EFO:0030003 |
| 10x 5' transcription profiling | EFO:0030004 |
| 10x technology | EFO:0008995 |
| Seq-Well | EFO:0008919 |
| Drop-seq | EFO:0008722 |
| CEL-seq2 | EFO:0010010 |
Gene-length Pre-normalization
In platforms that sequence full RNA molecules, such as Smart-seq, gene counts are directly correlated with gene length. To account for this, gene counts from these technologies are divided by the corresponding gene length prior to normalization.
For each gene in our reference files, length was calculated by creating non-overlapping meta-exons across all isoforms of a gene, and then adding up their length in base-pairs.
Data Normalization
Read counts are normalized using a log transformation of pseudocounts per 10,000 reads, ln(CPTT+1). Normalized matrices from multiple datasets of the same tissue are then concatenated.
This normalization is not designed to correct batch effects; while normalization and subsequent aggregation of data across many observations (mean expression values) mitigates these effects to some degree, users should be aware that batch effects may still be present in the data. See our manuscript for a detailed analysis.
Removal of Noisy Ultra-low Expression Values
After applying normalization, any gene/cell combination counts less or equal than 3 are set to missing data. This allows for removal of noise due to ultra-lowly expressed genes and provides a cleaner visualization.
Summarization of Data in Dot Plot
For each gene/cell type combination the following values are represented in the dot plot, either visually or in text upon hover.
- Gene expression (dot color) – the average ln(CPTT+1)-normalized gene expression among genes that have non-zero values.
- Scaled gene expression (dot color) – scaled mean expression to the range [0,1]. Scaling is done by assigning the minimum value in the current view to 0 and the max is assigned to 1.
- Expressing cells (dot size) – percentage of cells of the cell type expressing the gene, in parentheses is shown the absolute number of cells expressing the gene. These numbers are calculated after the following filters have been applied: "Removal of low coverage cells" and "Removal of noisy low expression values".
Expression and cell count rollup across descendants in the cell ontology
The cell ontology is a hierarchical tree structure that represents the relationship between cell types. For example, the cell type "B cell" is a descendant of the cell type "lymphocyte". For a particular cell type, the cell ontology is used to sum up the expression values and cell counts of cells labeled as that cell type as well as those labeled as its descendants. In the aforementioned example, the average expression of "lymphocyte" would include "B cells" and all its other descendants.
This rollup operation accounts for the fact that different datasets may have labeled their cells with different levels of granularity. It provides a more robust measure of the average expression of low-granularity cell type terms, such as "secretory cell" or "lymphocyte."
For validation demonstrating that this normalization technique recapitulates results of published studies, please see the validation section.