- CellxGene
- Find Published Data
- Contribute and Publish Data
- Download Published Data
- Analyze Public Data
- Get Started
- Hosted Tutorials
- Gene Expression Documentation
- Annotate and Analyze Your Data
- Join the CellxGene User Community
- Cite cellxgene in your publications
- Frequently Asked Questions
- Learn About Single Cell Data Analysis
Find Marker Genes
Genes that are highly enriched in a particular group of cells can be used as markers for that population. Marker genes are commonly used to identify cell types in single-cell RNA-seq data. In Gene Expression, we can use the Find Marker Genes tool to identify genes that are specific to a particular cell type relative to other cell types in its tissue.
Tutorial
First, let's select the lung tissue in Gene Expression. There is an info button next to each cell type label. Clicking the button opens a sidebar with the top 25 marker genes for that cell type:
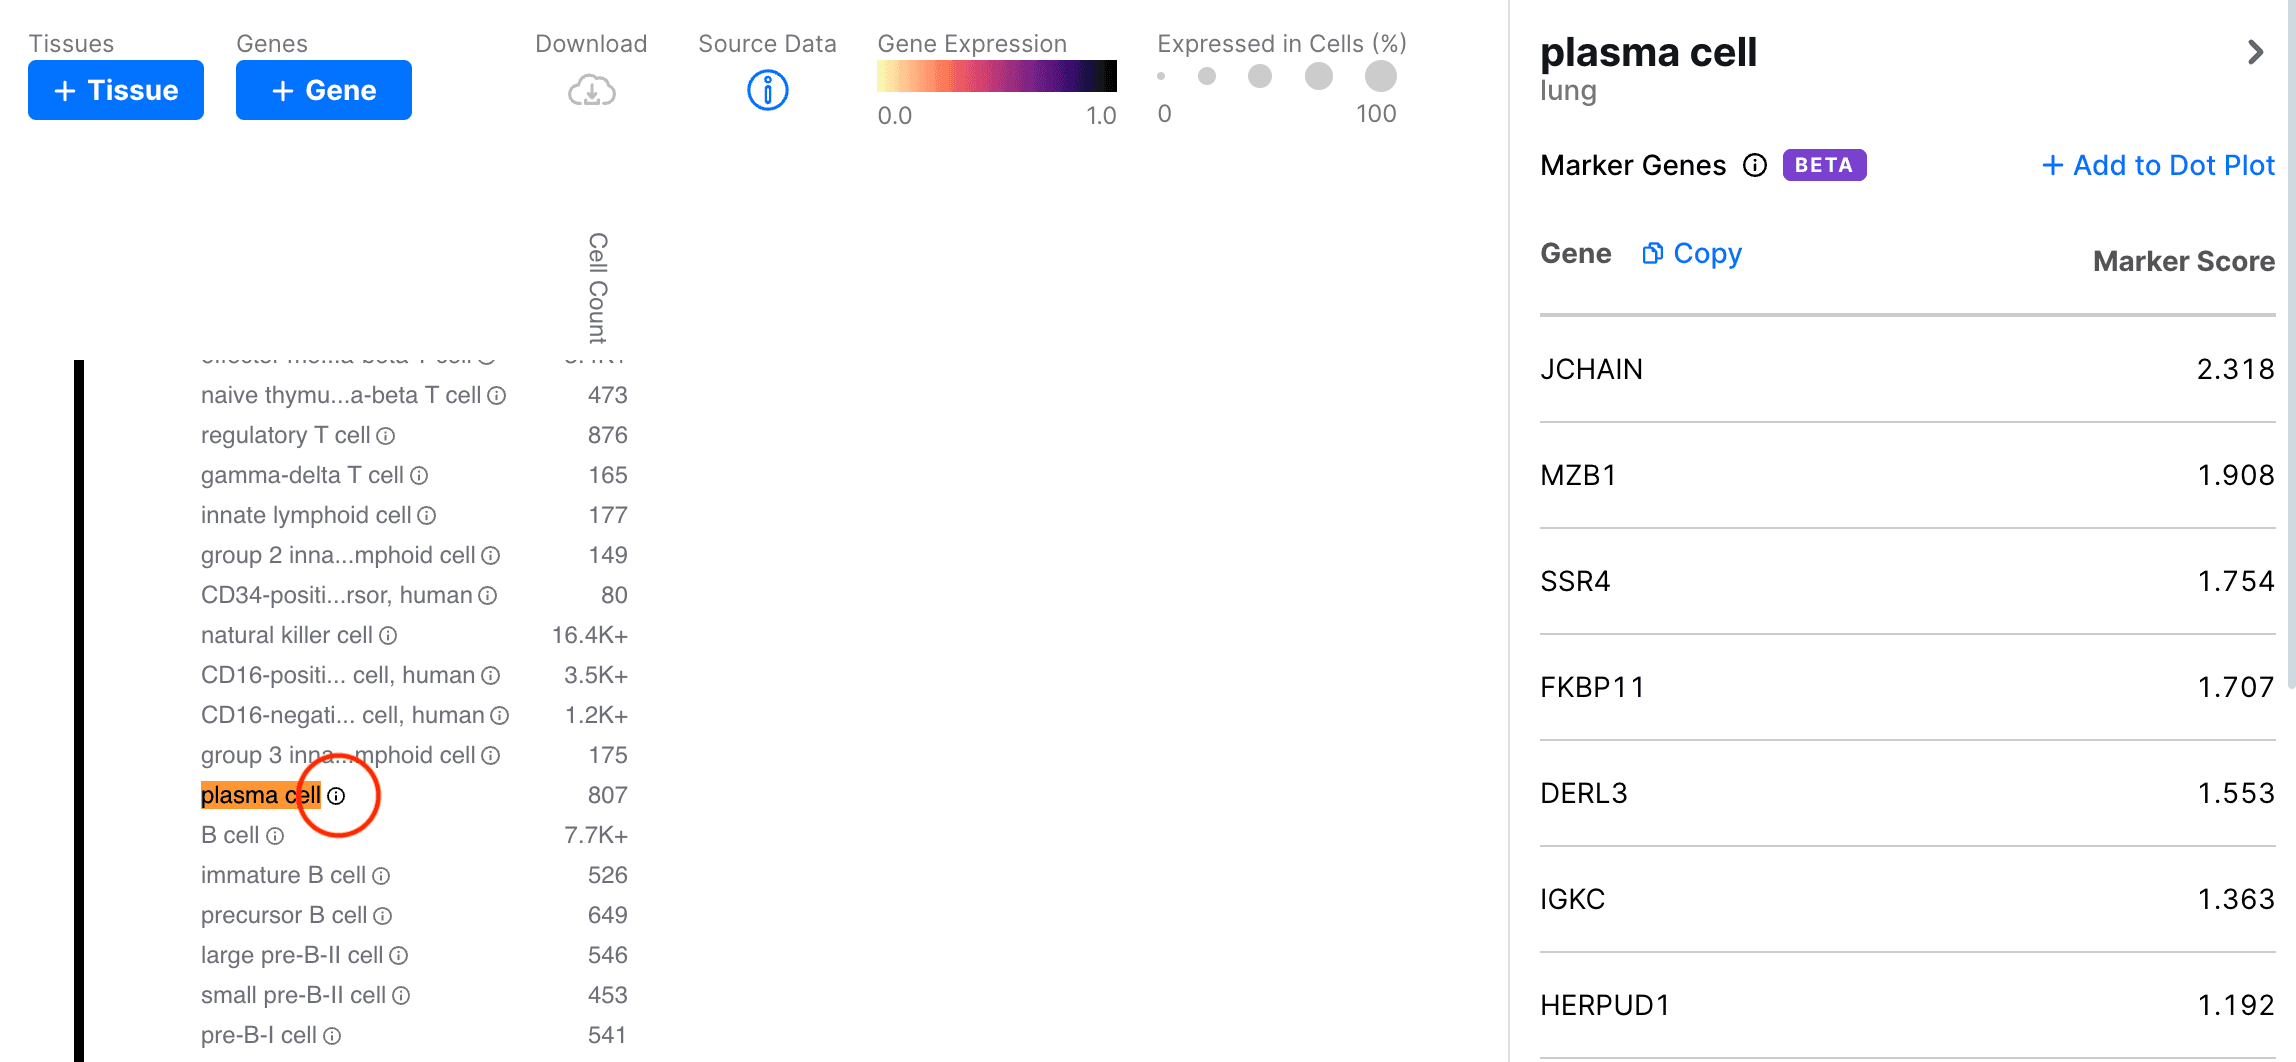
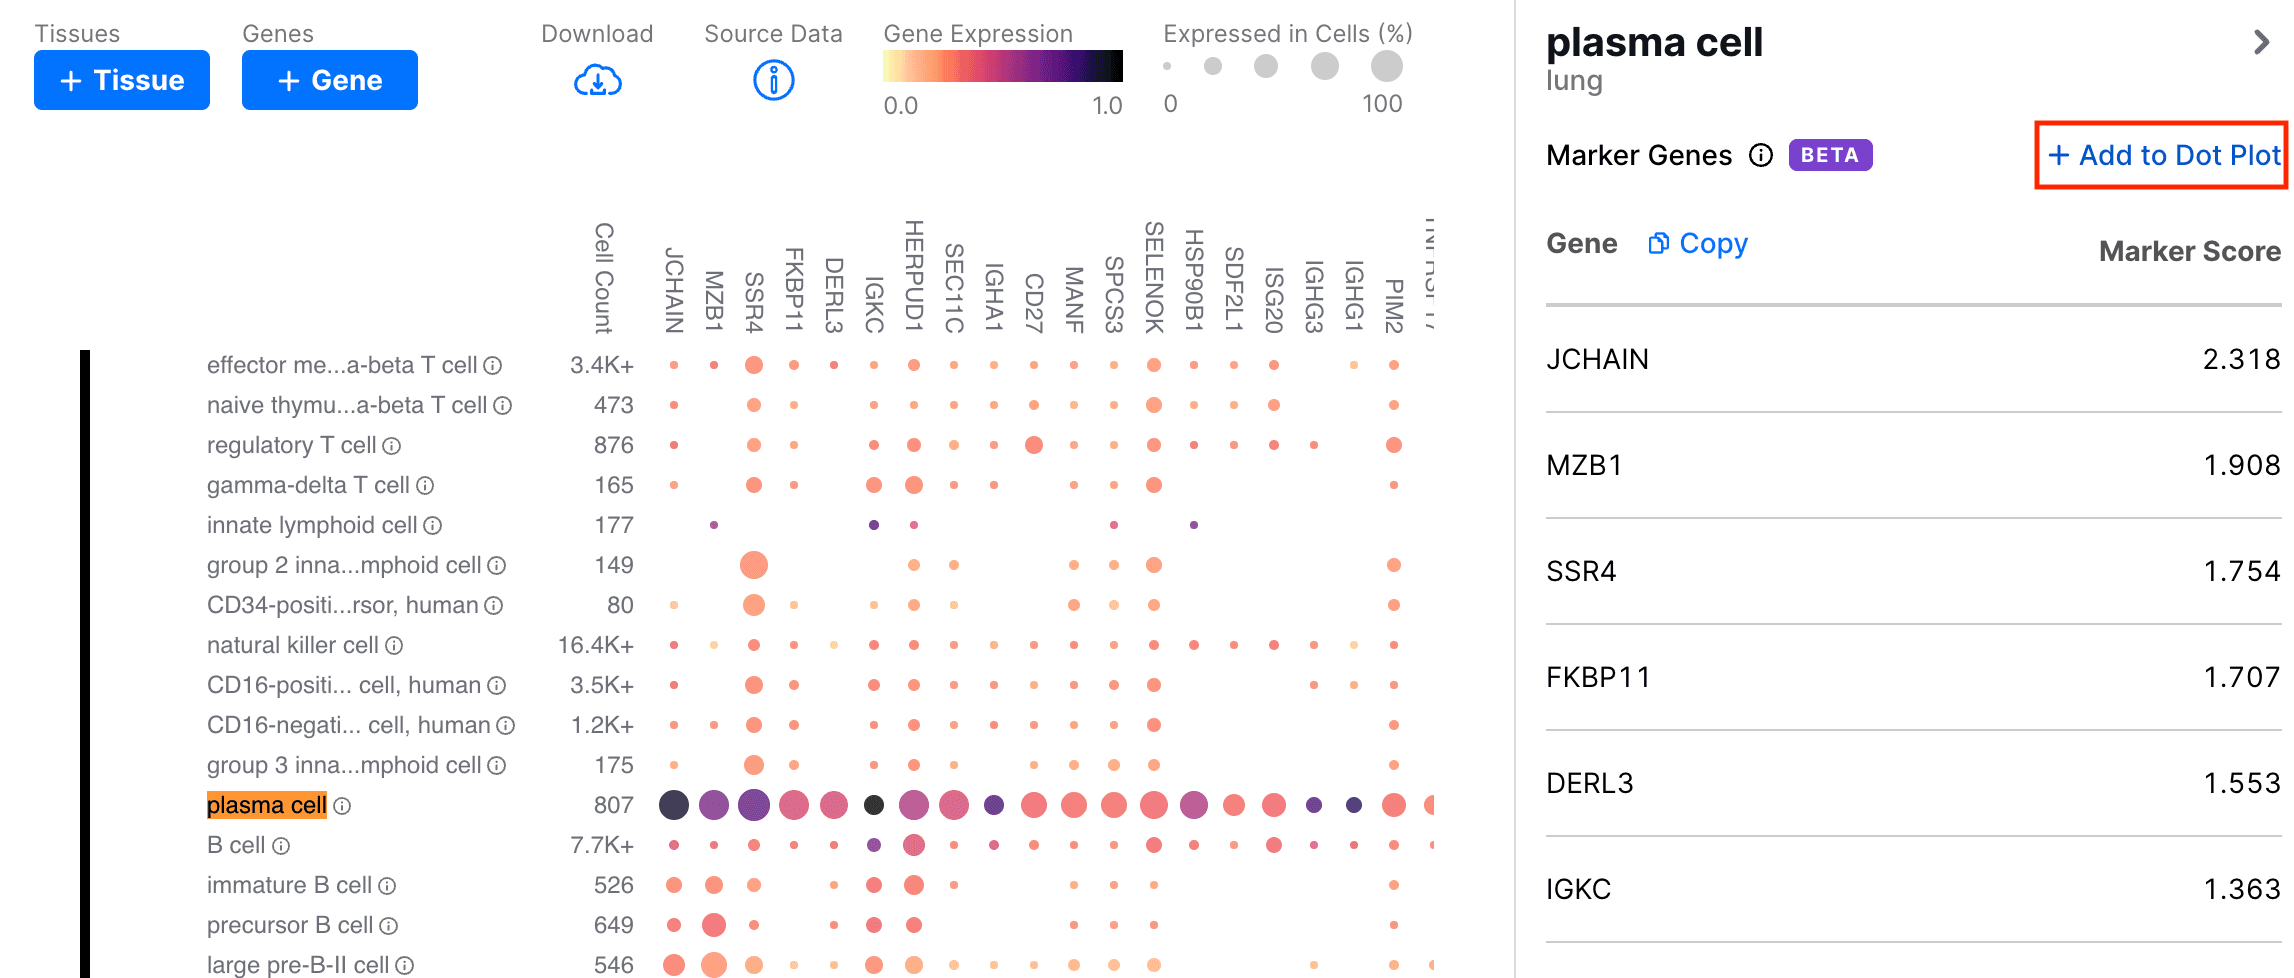
The marker genes are ranked by their Marker Score (see Algorithm for more details). In the sidebar, we can click the Add to Dot Plot button to add these genes to the heatmap.
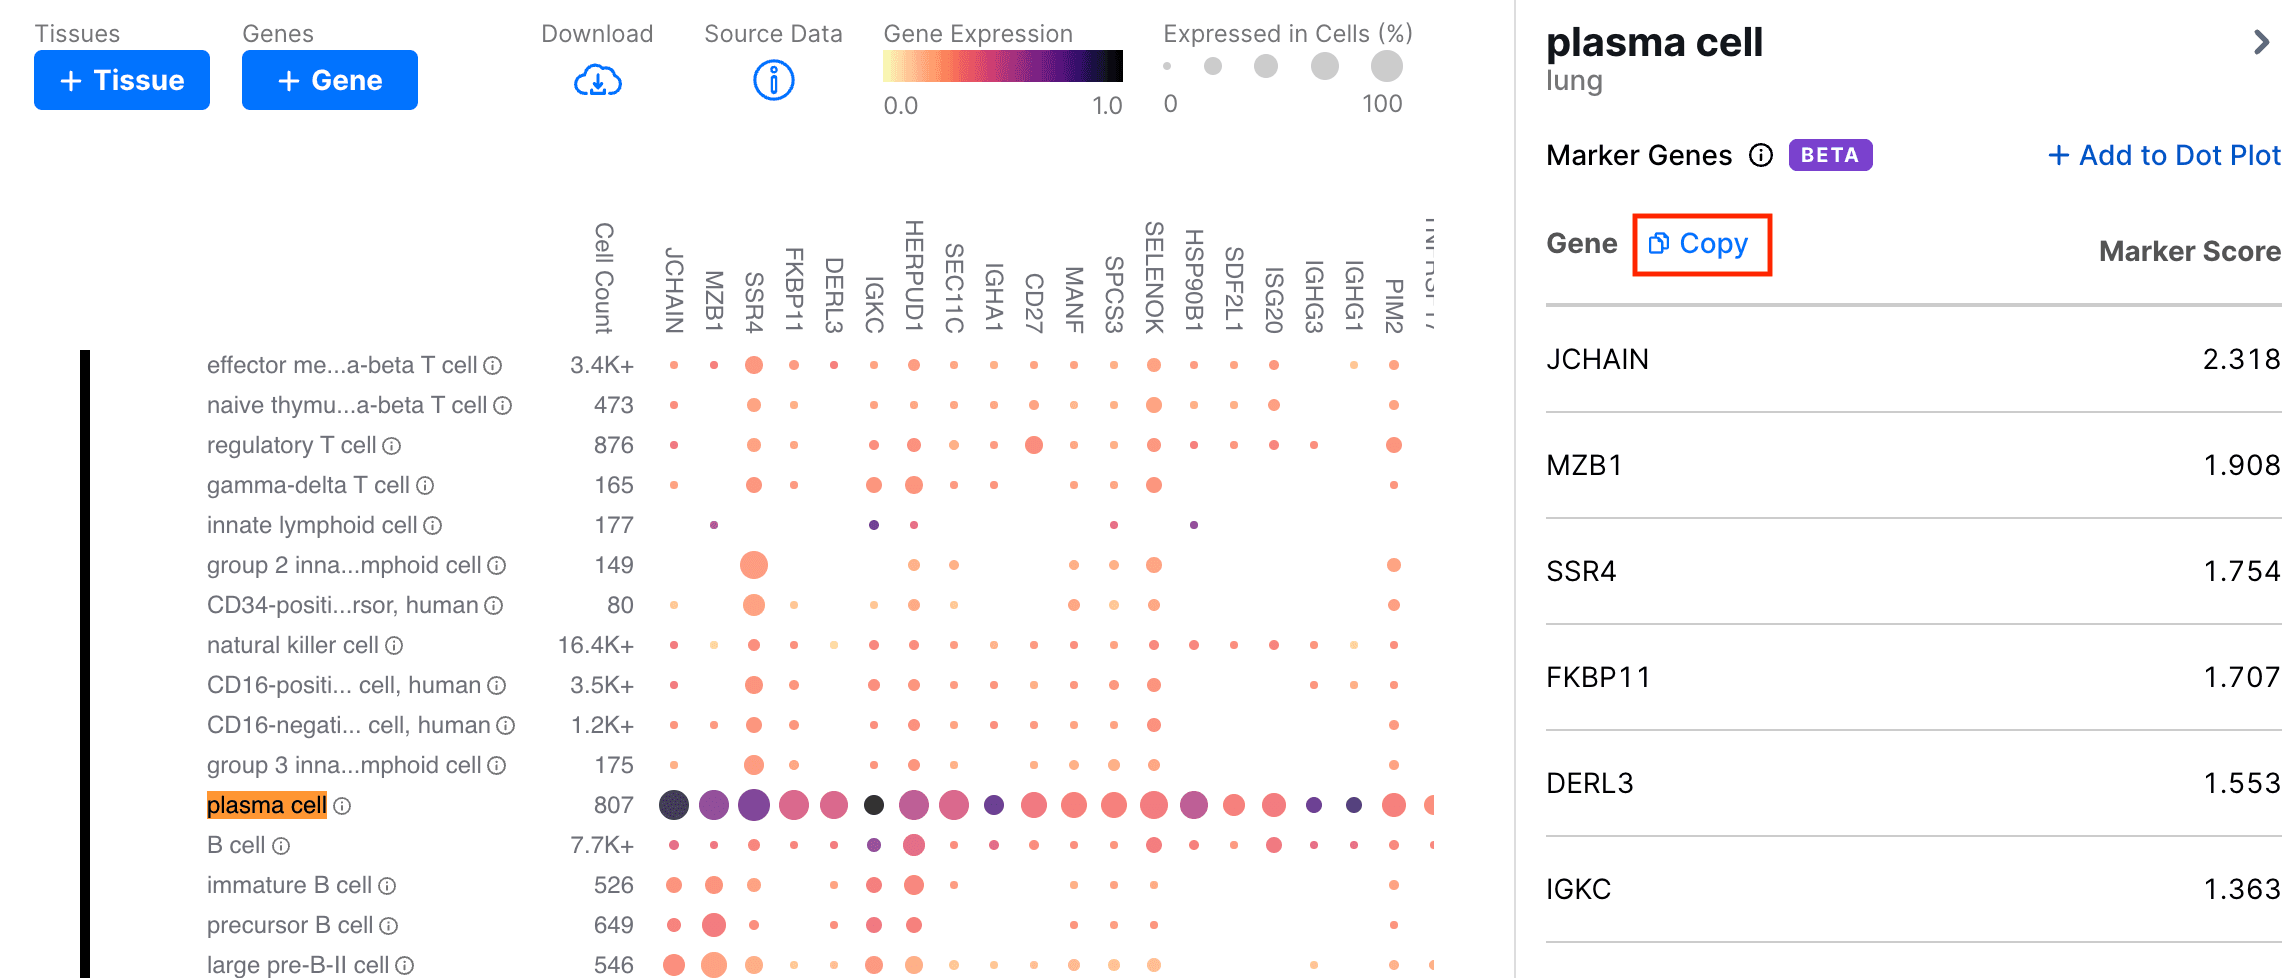
Clicking the Copy button copies a comma-separated list of the marker genes to the clipboard.
To minimize the sidebar, click the chevron in the upper-right corner of the sidebar.
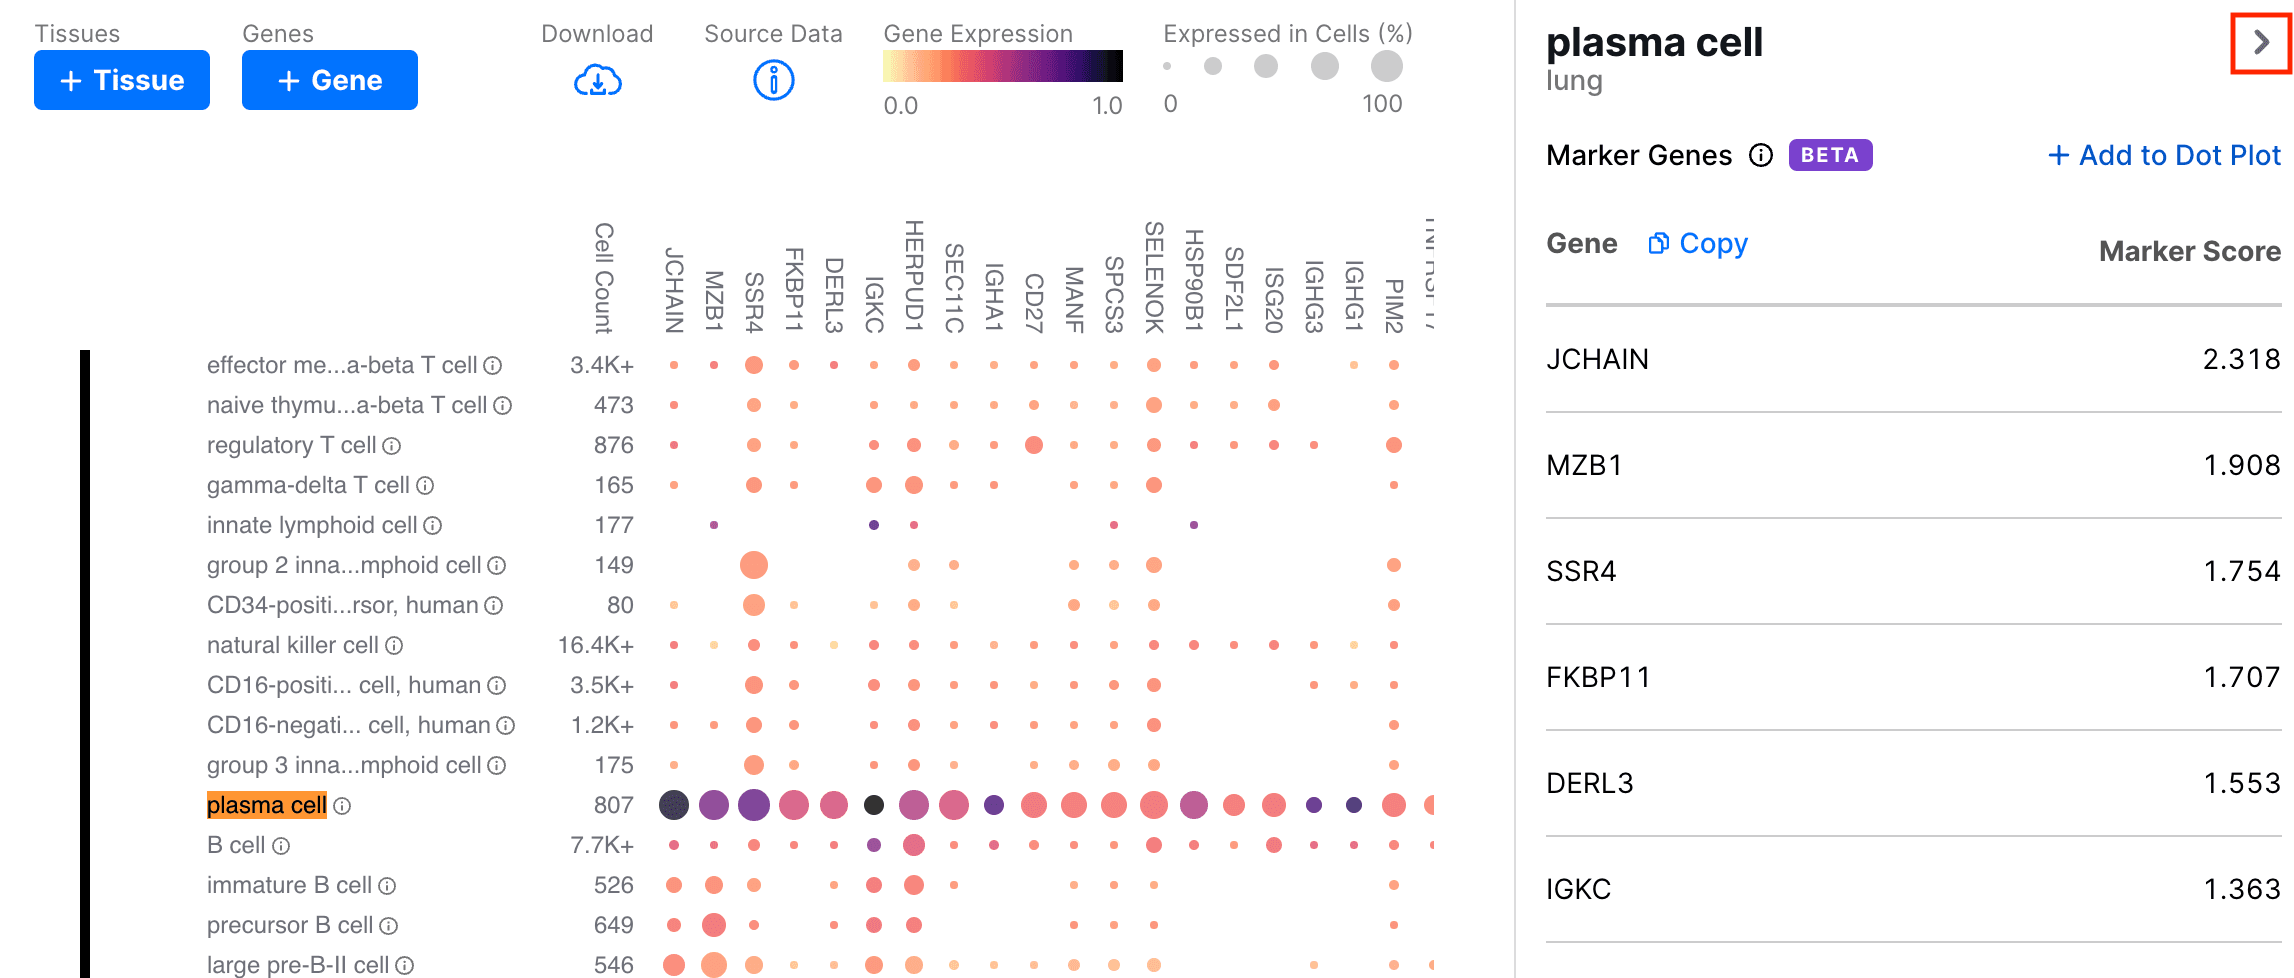
Clicking on the info button next to another cell type will replace the marker gene sidebar with the marker genes for the new cell type.
Algorithm
For a selected cell type in a tissue,
- Use Welch's t-test to compare the gene expressions in the selected cell type to each other cell type in the tissue.
- Note: each cell type contains cells labeled as that cell type as well as its descendants in the cell ontology. Consequently, cell types are only compared to other cell types that are not in the same lineage (i.e. comparisons with ancestors and descendants are ignored).
- Record the effect size for each gene in each comparison.
- For each gene, calculate the 10th percentile of the effect sizes across all comparisons. This is the marker score.
- Let
be the set of cell types in tissue . The marker score ( ) for gene in cell type is where is the 10th percentile operator and is the effect size of the t-test comparing in to .
- Let
- For a few of comparisons, the 10th percentile can be a noisy metric. To improve its robustness, we bootstrap the distribution of effect sizes for each gene, taking the 10th percentile of each replicate, and averaging all replicates to get the final effect size.
- Sort the genes by their marker score in descending order and return the top 25.
Welch's t-test
Welch's t-test is a statistical test for comparing the means of two independent samples with unequal sample sizes and variances. For a particular gene,
- Let two groups of cells be
and . Calculate the following values: and are the average expression of the gene in and respectively. and are the standard deviations of the gene in and respectively. and are the number of cells in and respectively excluding cells from datasets that did not measure the gene.
- Calculate the effect size (Cohen's d):
.
- Calculate the t-statistic
: .
- Approximate degrees of freedom using Satterthwaite formula:
.
- Calculate the p-value using the t-distribution (
).
Caveats
- It is important to note that some methodological decisions were made to balance accuracy with efficiency and scalability. For example, we use a t-test to perform differential expression, which is a simple and fast test. However, it may not be as accurate as more sophisticated (and computationally intensive) statistical tests.
- While differential expression is typically performed on raw counts for single-cell RNA sequencing data, we opted to use the normalized values in order to identify marker genes that corroborate the gene expressions shown in the dot plot.
- For the beta, we opted to not report the p-values for each gene. Though we can calculate approximate p-values using the t-statistic and degrees of freedom calculated in Welch's t-test, it is difficult to accurately aggregate the p-values for each gene across all comparisons. The most reliable method involves repeatedly permuting the data to generate a null distribution, but this is computationally intensive.
- Currently, marker genes are only calculated for cell types in tissues using only healthy cells. Applying secondary filters to the data (like disease, ethnicity, etc.) does not affect the results. Enabling dynamic calculation of marker genes for arbitrary populations of cells in arbitrary subsets of the data may be a direction for future development.
- Ideal marker genes for a particular cell type are expressed in all of its cells and not expressed anywhere else: they have binary expression patterns. In reality, almost no genes have truly binary expression patterns. Instead, they have genes that are statistically enriched in their cells relative to all other cell types. Additionally, genes may be good markers for a cell type in one context (e.g. a tissue) but not another (e.g. the entire human body).
Marker genes are not available for blood or small populations of cells
It may be difficult to identify any good markers for some cell types, especially if they have a small number of cells or are compared to many similar cell types. To account for the former scenario, marker genes are not displayed for cell types with fewer than 25 cells. The latter scenario is particularly relevant in the blood as it contains many closely-related cell types. As a result, we have temporarily disabled the find marker genes feature for cell types in blood.